Your Greater Plymouth, MA Real Estate Advantage
The Van Doren Group is so much more than just working with an agent to list your home. I provide a complete, hands-on experience tailored specifically for homeowners selling in Plymouth, MA and the Greater Plymouth Area. I live, work, and volunteer throughout the community, which means when you work with me, you benefit from hyper-local knowledge at both the macro and micro level — and a pricing, marketing and negotiation strategy built around your specific goals, not a one-size-fits-all approach.

Integrated Local Expertise
Market analysis meets strategic problem solving to deliver tangible results.

Strategic Market Insights:
Get data-driven advice for smarter decisions.

Maximum Value
Cutting-edge marketing gets your home in front of the RIGHT buyers, backed by the pricing strategy and negotiation to turn that interest into your best possible offer — on budget and on your timeline.

Home Projects Cost vs. Value Index Chart
2025 Cost vs. Value Report — Boston, MA compared with New England and national averages. Ranked by Boston cost recouped (resale value ÷ job cost).
| Project | Boston | New England | 2025 National Averages | ||||||
|---|---|---|---|---|---|---|---|---|---|
| Job Cost | Resale | Recouped | Job Cost | Resale | Recouped | Job Cost | Resale | Recouped | |
| Garage Door Replacement | $4,312 | $12,240 | 283.9% | $4,317 | $15,081 | 349.3% | $4,672 | $12,507 | 267.7% |
| Entry Door Replacement Steel | $2,549 | $4,437 | 174.1% | $2,547 | $4,659 | 182.9% | $2,435 | $5,270 | 216.4% |
| Manufactured Stone Veneer | $13,085 | $17,585 | 134.4% | $13,045 | $17,290 | 132.5% | $11,702 | $24,328 | 207.9% |
| Minor Kitchen Remodel Midrange | $28,991 | $34,565 | 119.2% | $28,936 | $38,865 | 134.3% | $28,458 | $32,141 | 112.9% |
| Siding Replacement Fiber-Cement | $20,568 | $23,973 | 116.6% | $20,678 | $29,963 | 144.9% | $21,485 | $24,420 | 113.7% |
| Backup Power Generator | $14,548 | $14,559 | 100.1% | $14,292 | $14,688 | 102.8% | $13,534 | $12,902 | 95.3% |
| Siding Replacement Vinyl | $17,523 | $16,850 | 96.2% | $17,590 | $16,314 | 92.7% | $17,950 | $17,313 | 96.5% |
| HVAC Conversion Electrification | $22,446 | $18,471 | 82.3% | $22,177 | $20,357 | 91.8% | $19,484 | $14,053 | 72.1% |
| Deck Addition Composite | $25,806 | $18,698 | 72.5% | $25,817 | $24,729 | 95.8% | $25,096 | $22,199 | 88.5% |
| Window Replacement Vinyl | $21,977 | $15,318 | 69.7% | $21,922 | $15,611 | 71.2% | $22,073 | $16,657 | 75.5% |
| Window Replacement Wood | $27,311 | $18,664 | 68.3% | $27,226 | $18,987 | 69.7% | $26,781 | $18,764 | 70.1% |
| Deck Addition Wood | $20,594 | $13,664 | 66.4% | $20,603 | $16,288 | 79.1% | $18,263 | $17,323 | 94.9% |
| Bath Remodel Midrange | $27,681 | $18,086 | 65.3% | $27,559 | $24,937 | 90.5% | $26,138 | $20,915 | 80% |
| Grand Entrance Fiberglass | $11,957 | $7,778 | 65% | $11,953 | $10,411 | 87.1% | $11,754 | $9,959 | 84.7% |
| Basement Remodel | $54,949 | $34,399 | 62.6% | $54,505 | $38,073 | 69.9% | $52,012 | $36,905 | 71% |
| Roofing Replacement Asphalt Shingles | $35,658 | $21,177 | 59.4% | $35,701 | $22,346 | 62.6% | $31,871 | $21,501 | 67.5% |
| Bath Remodel Universal Design | $43,256 | $23,884 | 55.2% | $43,119 | $25,963 | 60.2% | $42,183 | $25,812 | 61.2% |
| Backyard Patio | $53,526 | $23,667 | 44.2% | $53,455 | $31,584 | 59.1% | $51,454 | $23,672 | 46% |
| Bathroom Addition Midrange | $64,220 | $27,272 | 42.5% | $63,783 | $28,077 | 44% | $60,645 | $32,347 | 53.3% |
| Major Kitchen Remodel Midrange | $84,331 | $34,393 | 40.8% | $84,000 | $42,357 | 50.4% | $82,793 | $42,130 | 50.9% |
| Roofing Replacement Metal | $56,042 | $22,465 | 40.1% | $56,282 | $21,904 | 38.9% | $51,865 | $25,972 | 50.1% |
| Accessory Dwelling Unit | $175,692 | $70,117 | 39.9% | $173,734 | $70,654 | 40.7% | $166,406 | $68,656 | 41.3% |
| Primary Suite Addition Midrange | $183,267 | $71,779 | 39.2% | $181,780 | $70,459 | 38.8% | $170,517 | $55,097 | 32.3% |
| Bath Remodel Upscale | $84,165 | $29,003 | 34.5% | $83,877 | $37,705 | 45% | $81,612 | $34,000 | 41.7% |
| Bathroom Addition Upscale | $116,910 | $34,734 | 29.7% | $116,146 | $41,268 | 35.5% | $111,255 | $40,526 | 36.4% |
| Solar Power Installation | $59,366 | $17,258 | 29.1% | $58,913 | $14,495 | 24.6% | $55,937 | $16,625 | 29.7% |
| Major Kitchen Remodel Upscale | $173,271 | $48,412 | 27.9% | $172,718 | $63,959 | 37% | $164,104 | $58,561 | 35.7% |
| Primary Suite Addition Upscale | $379,392 | $68,946 | 18.2% | $374,737 | $57,321 | 15.3% | $351,613 | $63,136 | 18% |
Source: 2025 Cost vs. Value Report by Zonda and the Journal of Light Construction (Zonda). Results are estimates and vary by home, project and market.
Your All-in-One Partner

Real Estate Market Services
I provide in-depth Comparative Market Analysis (CMA) to help you make smarter, data-driven decisions.

Project Management Services
I also coordinate residential improvement projects with trusted local contractors when it helps maximize your sale price.
Maximum Exposure, Not Like Other Agents
“I don't just market your property — I pull from my second-to-none local and national network, and from Real's mastery of technology and analytics, to efficiently and aggressively put your home in front of the RIGHT buyers.”
My Service Location
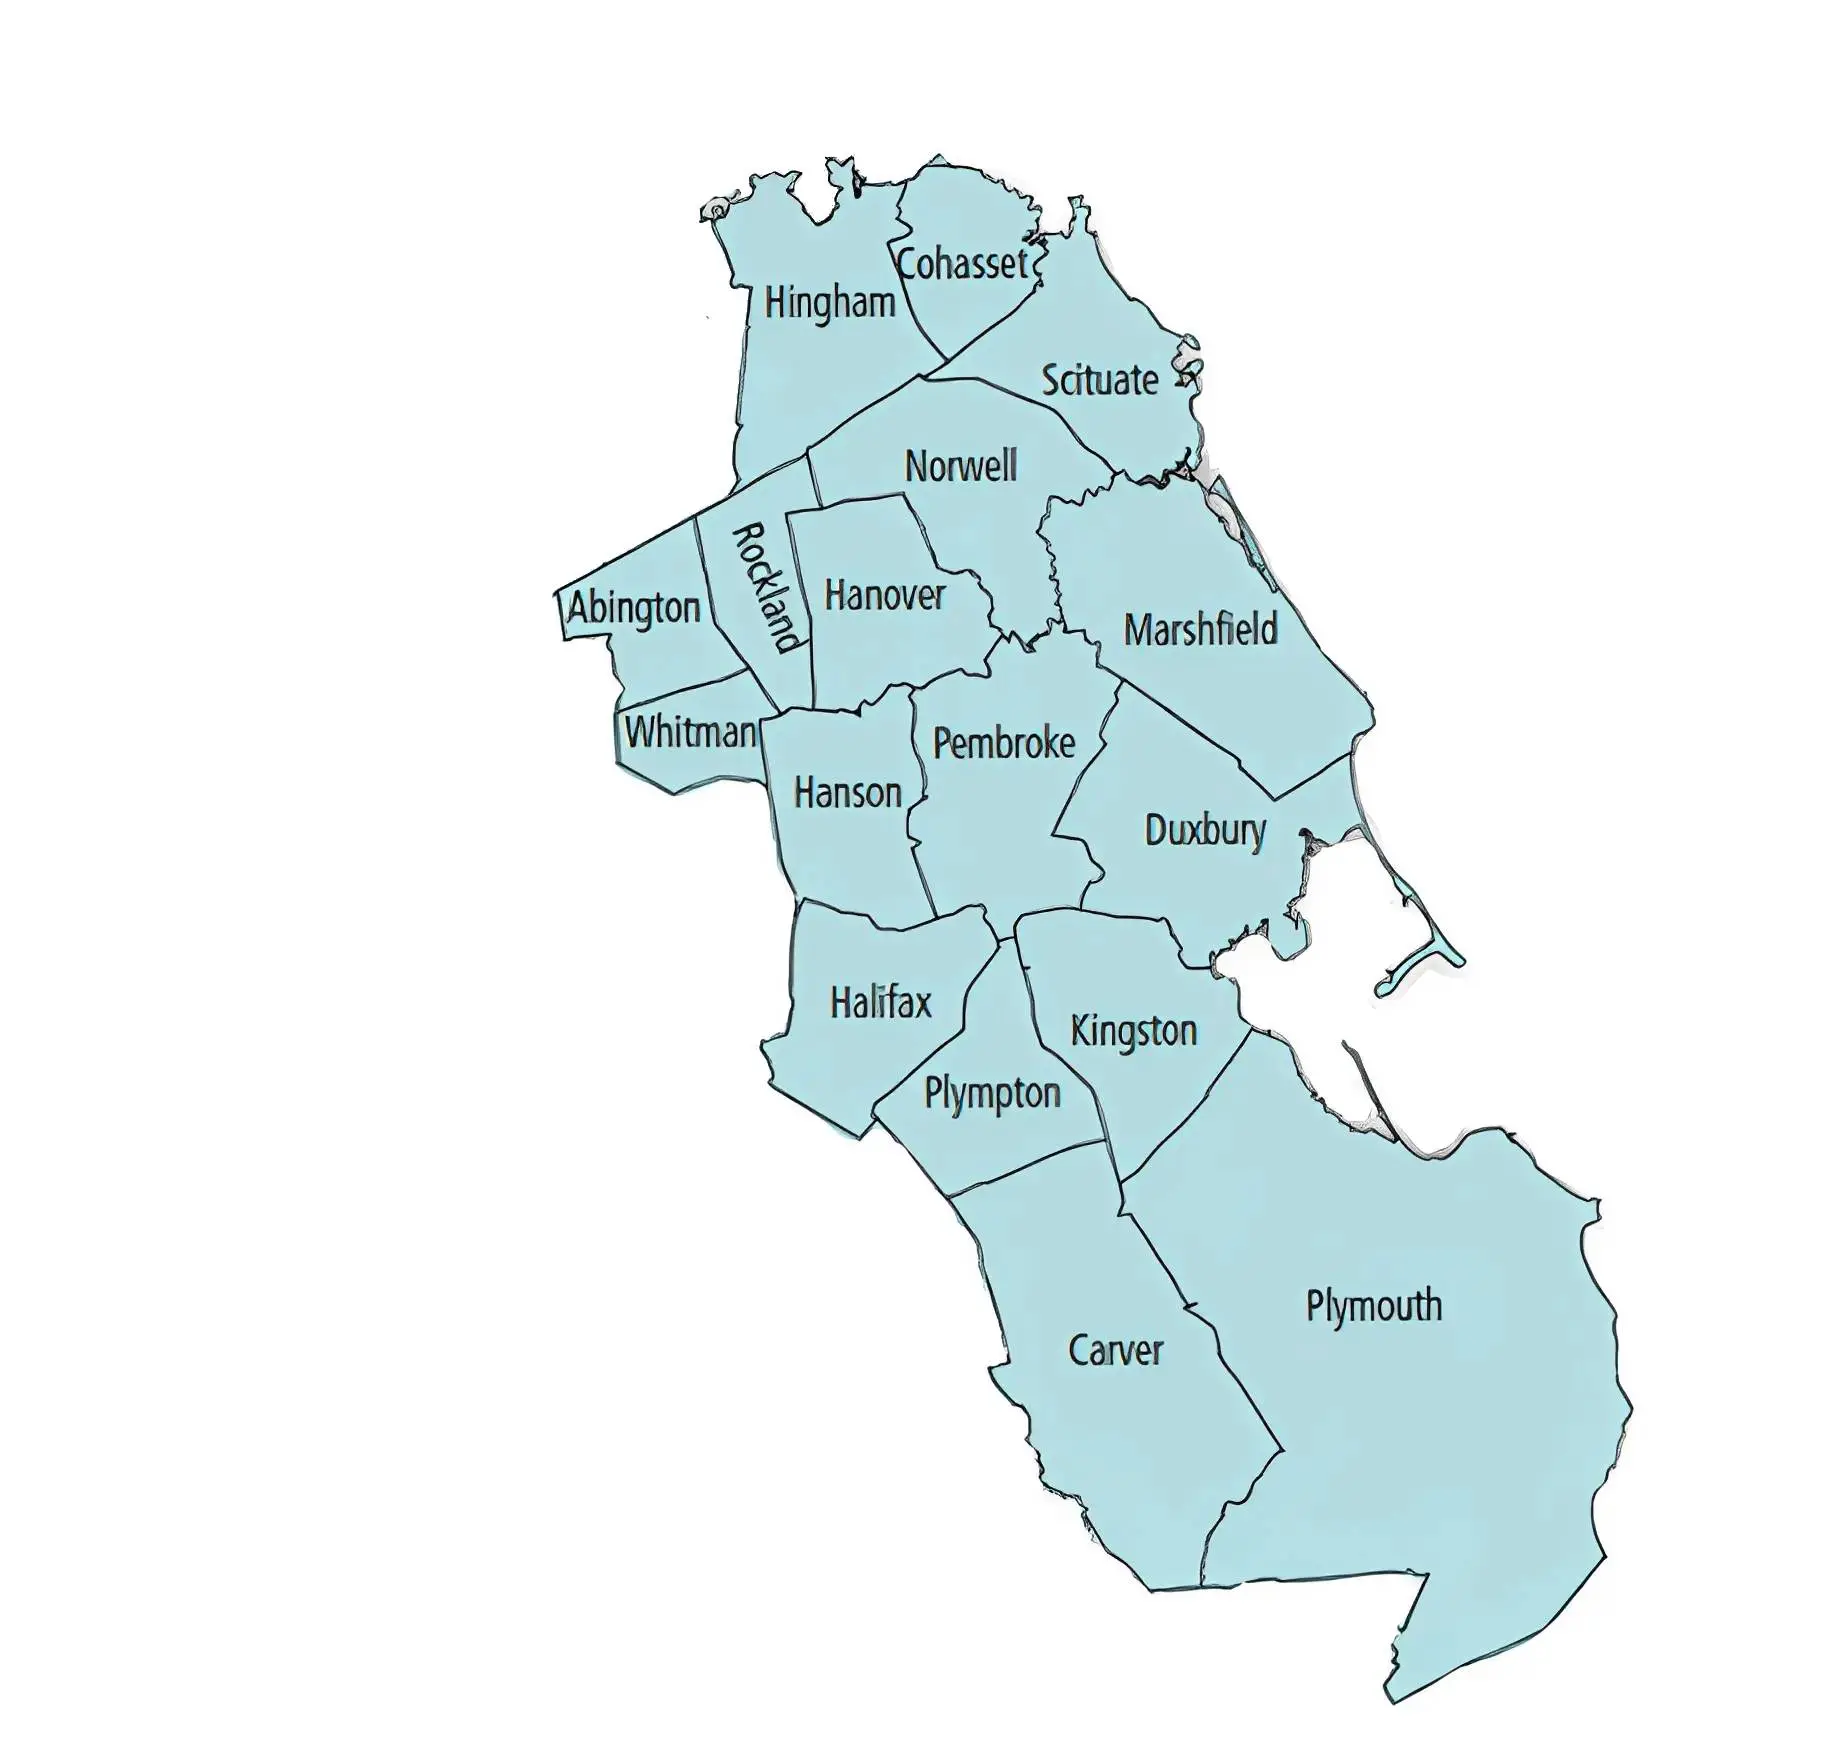
I proudly serve homeowners and buyers throughout Plymouth, Manomet, Kingston, Duxbury, Marshfield, Hanover, Pembroke, and the greater South Shore of Massachusetts. Living and working in this community means I bring hyper-local market knowledge to every transaction — from neighborhood pricing trends to the contractors and vendors who can get your home show-ready fast.